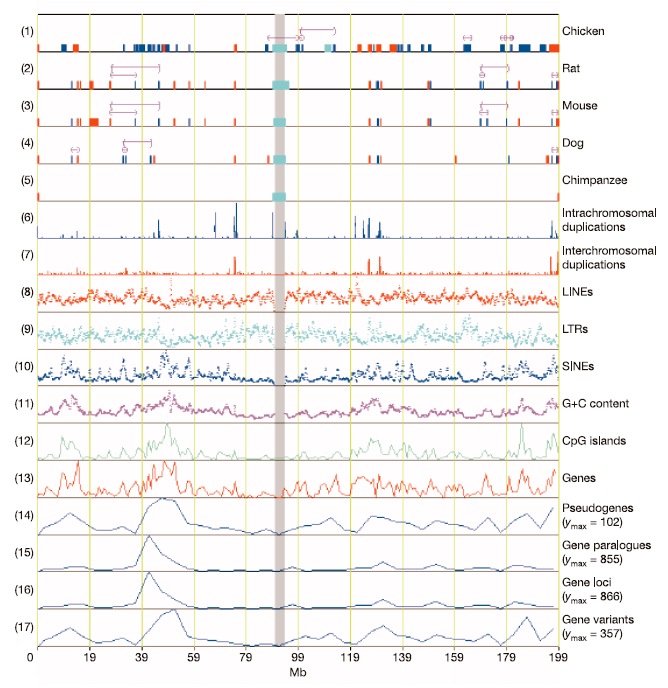
Figure 1. Correlation of syntenic breakpoints with general chromosome landscape features.
Tracks are numbered on the left and syntenic
alignments across the human chromosome are shown in the top five tracks:
(1) human-chicken; (2) human-rat; (3) human-mouse; (4) human-dog;
and (5) human-chimpanzee. The inter- and intrachromosomal breakpoints
are represented by red and blue gaps, respectively. Cyan gaps indicate
regions without sequence alignment and the centromere is located in the
cyan gap that is common to all species. Pink brackets indicate sequence
inversions. The density of recent segmental intra- and interchromosomal
duplications from low-copy repeats is shown in tracks (6) and (7). The
incidence of major interspersed (high-copy) repeats are depicted in tracks
(8), (9) and (10) for LINEs, LTRs and SINEs, respectively. The variations in
G+C content, and densities of CpG islands, genes and pseudogenes appear
in tracks (11), (12), (13) and (14), respectively, whereas gene paralogue
density, gene density and gene variant density appear in tracks (15), (16) and
(17), respectively. Gene density in track 13 is from UCSC 'known genes',
whereas track 16 reflects the non-redundant locus annotations detailed in
this study. ( The above image is linked t
o the Human Chr 3 annotation data deposited in Genboree. )