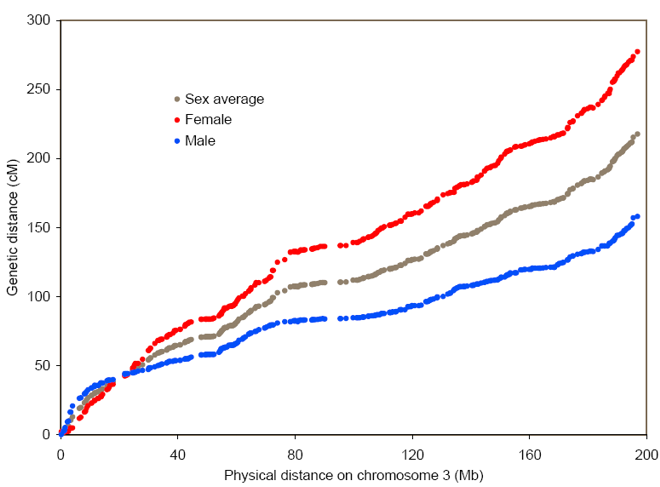
Supplemental Figure 2. Comparison of Physical and Genetic Map Distance.
Markers from the deCODE genetic map were localized to the
sequence and the genetic and physical maps were aligned from the telomere of
the short arm to the telomere of the long arm. The position of each genetic
marker on the female (red), male (blue), and the sex-averaged (gray) genetic map is
indicated. ( The above image is linked to the Human Chr 3 annotation data deposited in Genboree. )