| HELP TOPIC: "7. Tabular View and Layout Design" |
The tabular view is an alternative form of annotations display in which the data is displayed in a customizable tabular format, as opposed to the customizable graphical format created by the Genboree Genome Browser.
Using this tool, users can create a custom table layout by specifing what data should be displayed and in what order, how the data should be sorted, and whether or not the data should be grouped. These custom layouts can be applied to one or more data tracks from a single database and, depending on permissions, can be saved and shared with other group members or to be reused on other data tracks. In this way, the tool can be used to create "reports" that display specific annotation data relevant to the report type.
Temporary layouts can be created by anyone who has read access to a database, for a one-time display of data. For users with write access to a database, multiple layouts can be created, updated, and saved for reuse. These layouts can be applied to any track or combination of tracks associated with the original database. When applying a layout to a track that does not contain all of the original data attributes displayed when the layout was created, Genboree will simply drop those attributes from the display and / or sort lists.
Both online viewing of the data in the web browser and download of tab-delimited table data are supported. Online viewing is most appropriate for small datasets, since the browser can only handle so many rows on a page and paging manually through tens or hundreds of thousands of annotations is unreasonable. Downloading the data makes it available for import into to other programs you may have on your personal computer, such as further analysis and manipulation by local analysis tools.
The Tabular View Tool is integrated into the Genboree system. In order to access the tool, you must first log in to the Genboree Browser, it is not currently accessible via the Genboree Menu system. Follow these directions in order to access the tool.
- Log into Genboree.
- Click on Browser in the menu.
- Select the appropriate Group and Database in the drop-down lists.
- Click on a track of interest.
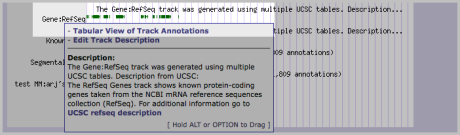
You will see the pop-up window with a link "Tabular view of track annotations". Click the link to launch the tool.
The performance of the tabular layout has been optimized to perform well when dealing with large data sets. Even so, large datasets will require noticeably longer processing times than smaller datasets. Additionally, when user-defined attributes are used as a sort parameter, processing times will dramatically increase. This is a result of the way that the data is stored in the Genboree database. Be advised, it is not recommended to use user-defined attributes as a sort parameter unless you cannot achieve the same sort order by using the standard annotation attributes.
In any situation where the tool determines that the data processing time is expected to exceed a typical execution time, the user will be warned of the expected delay. If you see this warning, please be patient and do not navigate to a different page until the table is displayed, or data file begins to download.
The Tabular View Tool was designed to provide you with an easy to use interface for arranging annotations into a Table or Grid within the context of the Genboree System itself. The columns of this table are user defined out of the "Core Annotation Attributes" and any track specific "User-Defined Attributes". Additionally, you are able to impose a sort order according to any of the attibutes of the annotation, even if the attributes are not displayed in the Table. Finally, you are able to group annotations according to their names, and their attributes will appear combined in the Table.
In order to build a Tabular View using the Tabular View Tool, there are two easy steps to follow:
- Selecting the data tracks to be used in the Table
- Selecting or creating a layout to apply to the data
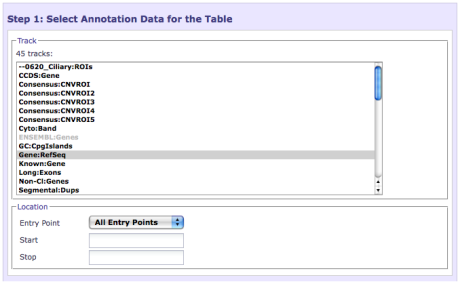
The first step of the process is very straight-forward. In most cases, after you select a data track from the Browser, you can continue on to the second step of the process. Alternatively, you can select additional data tracks (Shift/Ctrl + Click, or Shift/Command + Click on a Mac) to be used in the Table. Additionally, you can change your group and database from this page if you so desire.
Note: Currently, you are not able to select multiple data tracks from different databases.
After selecting the data tracks to be used in this Table, you can limit the annotations based upon location by using the Location section. You can select a single Entry Point from the drop-down list, and specify a Start and Stop position if you would like. You can leave the Start / Stop textfields empty to simply specify an entire Entry Point.
Note: You must specify either both a Start and Stop position, or neither.
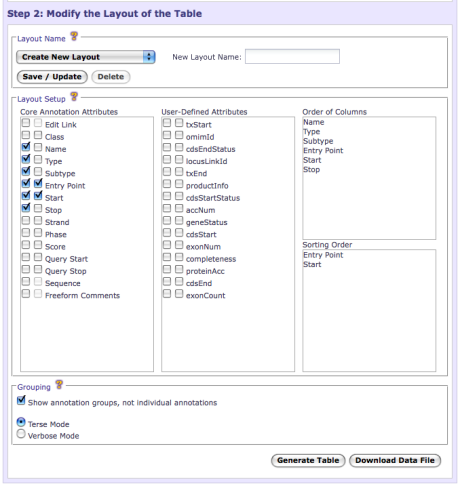
In the second step of this process you can either apply a default or previously saved Layout (described in the next section), or create your own temporary layout. To Apply a default or previously saved layout, simply use the drop-down list in the "Layout Name" section. Changing the selection of this drop-down list will auotmatically change the settings in the remainder of the interface. After you have selected or created a layout for your Table, press the "Generate Table" button to see your data displayed in the Table. Additionally, you may press the "Download Data File" button to download your Table as a tab-delimited file.
A layout is a user-defined format of a tabular view of data that allows you to specify fields to display as columns, the order of those columns, which attributes to use to sort the rows (and in what order), and how to group the data.
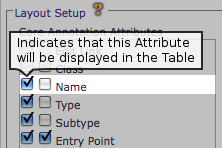
The "Layout Setup" interface shown in "Step 2" can be used to create or modify layouts. This section of the interface has three columns. The first column shows all of the "Core Annotation Attributes" common to all of the annotations in the Genboree system. The second column shows the "User-Defined Attributes" specific to the data track selection. Both of these columns are used in very similar ways. Next to each Attribute in these columns, there are two checkboxes. The first checkbox is used to specify that an Attribute should be displayed as a column in the Table. Selecting this checkbox will make the Attribute appear in the third column, in the "Order of Columns" area.
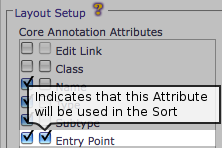
The second checkbox is used to specify that an Attribute should be used to sort the annotations that will appear in the Table. You can even use Attributes that are not displayed in the Table to sort the rows. Selecting this checkbox will make this Attribute appear in the "Sorting Order" area of the third column.
After you have selected all of the Attributes that you would like to appear in the Table and to be a part of the sort, you can modify the order of the columns and the sort by dragging the Attributes appearing in the third column of the interface. The first Attribute in the list under the "Order of Columns" section will appear as the left-most column in the Table. In the "Sorting Order" section of the column, the first Attribute in the list will be used to sort the data except in the case of a tie, where the next item in the list will be used to break the tie.
After you have specified the order of your data, you are able to change the grouping mode for your annotations. You can also disable annotation groups from this section of the interface.
If you have administrator rights on a database, you will be able to delete any layouts from the list. Simply select the layout from the drop-down menu and press the "Delete" button. The list will be automatically updated and the "Default Grouped Layout" will be loaded.
Each row in the table can be a specific annotation (e.g. each exon of a gene or each end of a mapped mate-pair) or each row can represent a whole annotation group (e.g. the whole gene or the whole mate-pair mapping).
More information on annotation groups can be found in Help Section 4.1 "What Are Annotations", but essentially if annotations in the same track and on the same chromosome (entry point) share the same name, they are considered part of a group.
When displaying annotation groups:
- - Name, class, type, subtype, and entry point must all be identical in order for a group to be created.
- - Group start is the smallest coordinate of the annotations in the group.
- - Group stop is the largest coordinate of the annotations in the group.
- - Group score is the average score of the annotations in the group.
- - Group strand is determined by majority vote.
- - Comments, sequence, phase, and user-defined attributes are either all listed or only identical values are listed depending on verbosity mode (See section 7.2.4)
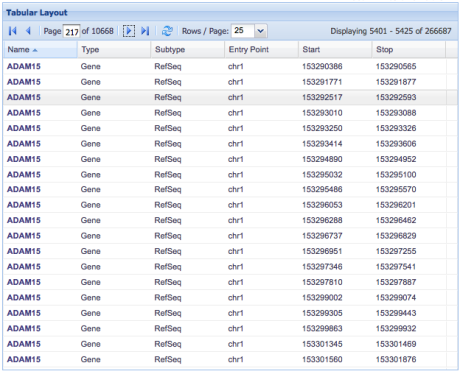
- - Gene ADAM15 annotations without grouping (1 row per exon):
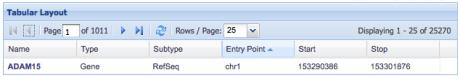
- - Gene ADAM15 annotations with grouping (1 row for whole gene):
- - In Verbose mode: phase, comments, sequence, and user-defined attributes from all individual annotations are displayed, separated by commas.
- - In Terse mode: only the phase, comments, sequence, and user-defined attributes with identical values in all annotations are displayed; otherwise the special keyword "{varies}" is displayed.
- - To allow users to edit annotations or annotation groups from the table display, the "Edit Link" field must be selected for display in the layout.
- - In the resulting tabular view that is generated, an Edit button will appear that will allow the users to access the Editor features of Genboree.
- - Data from shared databases such as templates are not editable, and the Edit Link column will contain the phrase Read only to signify this situation.
When a layout includes the Name attribute, it is automatically turned into a clickable link back to the graphical browser view of that annotation or annotation group. The display should appear centered and zoomed in on the annotation or annotation group that was clicked.
In order to allow for quicker re-sorting of the data after a tabular view has already been created, the header of each column presents a clickable sort button. These buttons will allow the user to add columns to the sort order as either an ascending or descending sort. The tabular view will remember the previous sort order as well, so any re-sorting in this manner will result in an addition to the previous sort order, not a replacement of it.
Whenever a user-defined attribute is included in the sort order, sorting performance will dramatically decrease. Please be patient when performing a sort of your dataset on a user-defined attribute.

|
© 2001-2026 Baylor College of Medicine
Bioinformatics Research Laboratory (400D Jewish Wing, MS:BCM225, 1 Baylor Plaza, Houston, TX 77030) |