| HELP TOPIC: “9. Virtual Genome Painter (VGP) Interface” |
On This Page:
- 9.1 The Virtual Genome Painter (VGP)
- 9.2 Selecting Entry Points
- 9.3 Specifying Images and Labels
- 9.4 Data Columns
- 9.5 Annotation Tracks
- 9.5.1 The Reference Track
- 9.5.2 Drawing Styles and Options
- 9.5.3 Adding Annotation Tracks
- 9.5.4 Updating Annotation Tracks
- 9.5.5 Removing Annotation Tracks
- 9.6 Submitting a VGP Job
The Virtual Genome Painter is a visualization tool developed by the BRL that summarizes annotation data in either a genome-wide or chromosome-specific manner. This flexible tool allows users to generate publication quality images from data stored in Genboree.
VGP offers a high-level of control over the resulting images by allowing users to customize virtually all aspects of the images, including: specifying entry points to be drawn, specifying the drawing style, drawing order and color of annotation data, as well specifying image labels such as legends and axis labels.
The VGP User Interface (UI) was created to provide users with a simple way to use this powerful command-line tool. The VGP UI helps simplify running the VGP application by creating the complex parameter files that control how VGP draws an image for the user and executing the application on Genboree servers.
The VGP UI provides a wizard-like interface for configuring a run of VGP. Each tab can be traversed in order by clicking the Next Step and Previous Step buttons. However visiting each tab is not required to configure VGP. If you are familiar with the VGP UI and know exactly which tab to visit to customize your desired option you can go directly to the tab by clicking on the tab title.
Under the Select Entry Points tab, a user can specify which entry points should be drawn in the images. If the Chromosome View images are enabled, a separate chromosome image will be created for each selected entry point. If the Genome View image is enabled then all selected entry points will be drawn in the genome view.
NOTE: At least one entry point must be selected for drawing
When there is a reasonably small number of entry points available (<100), the UI will display the available entry points as a list. An entry point can be enabled/disabled for drawing by checking the Draw check-box next to the entry point name. Disabled entry points will have a gray background. By default, all *_random entry points will not be drawn.
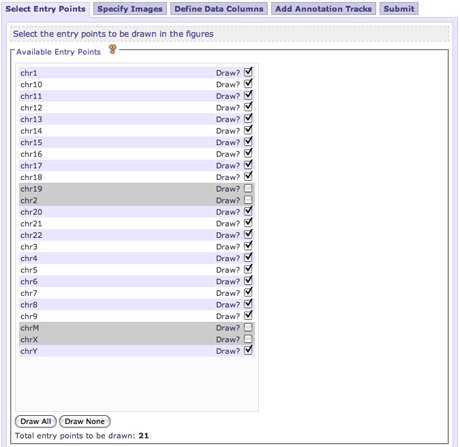
In this selection mode, Draw All and Draw None buttons are available to quickly select all or clear all entry points for drawing, respectively.
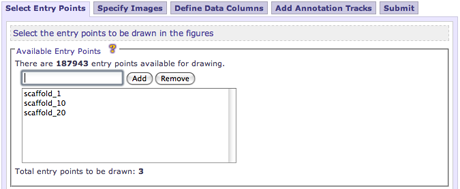
When the available entry points in a database is relatively large (>100), the UI will require the user to manually specify the entry points to be drawn by name. The UI will display the total number of entry points in the database along with a count of the current entry points specified. To add an entry point, enter the name into the text field and click the Add button. To remove an already specified entry point, select the entry point from the list and click the Remove button.
Any entry point can be segmented so only small pieces of the original entry point will be drawn. This can be particularly useful if a user wants to focus on a small piece of an entry point. A user can specify to draw only the defined entry point, the defined entry point and any segments specified or draw only the segments that are specified (the whole defined entry point will not be drawn). Each specified segment will appear as a new entry point ; each segment will have its own Chromosome View image and will appear as a unique entry point in the Genome View.
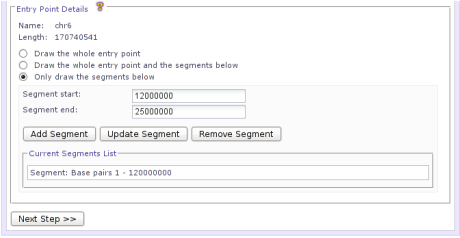
To add a segment to an entry point, first select an entry point from the Available Entry Points list. Upon selection, the name and length fields in the Entry Point Details section will be updated. Select either Draw the whole entry point and the segments below or Only draw the segments below to create a segment. Enter the desired entry point segment start and end positions then click the Add Segment button.
An entry point segment can be updated or removed using a similar process. Select the desired entry point from the Available Entry Points to view the current segments defined. Next select the desired segment from the Current Segments List. To upate the segment, change the segment start or end and then click the Update Segment button. To remove the segment, simply click the Remove Segemnt button.
If you want to simply disable the segments for drawing instead of deleting them, you can simply select Draw the whole entry point for the selected entry point.
VGP creates two types of images, the Genome View and Chromosome View images. The Specify Images tab provides options to customize those images as well as add a variety of image labels. Image labels can be added to provide additional information regarding your images and promote understanding for viewers.
In a run of VGP, you can only create one type of image at a time: either the Genome View or the Chromosome Views. Rarely do the same track widths and margins for both image types produce attractive results. The simplest method for creating both image types is to configure the VGP UI for one image type, set the margins and track widths for that type and then submit the VGP job (via the Submit tab). After submitting, click the Specify Images tab and select the other image type for drawing. Then proceed to change the margins and track widths to suitable values for any desired data columns or annotation tracks. Finally submit a new VGP job for this new image type.
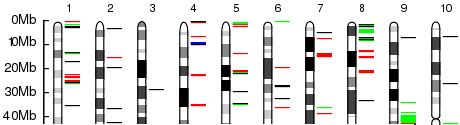
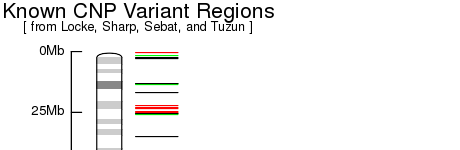
The Genome View draws annotations from all entry points in a horizontal side-by-side fashion on the same canvas. This view provides a high level visual overview and allows for easy comparison between annotations of all entry points.
A slice of a Genome View image:
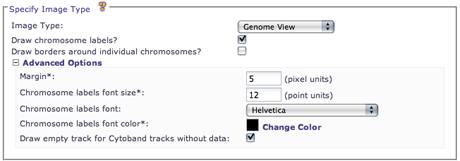
The Genome View UI widgets with the Advanced Options expanded:
The Genome View can be enabled or disabled by checking or unchecking the Create genome view? check-box.
Chromosome labels are drawn above each respective entry point in the Genome View. The text label displayed corresponds to the entry point name as defined in Genboree. Chromosome labels can be enabled or disabled by checking or unchecking the Draw chromosome labels? check-box.
The chromosome labels are text components and the font attributes can be altered.
NOTE: If the entry points are chromosomes then just the chromosome number will be displayed. For example, the chromosome label for “chr1” would simply be “1”
A border can be drawn around each entry point figure in the Genome View to help differentiate entry points. The Draw borders around individual chromosomes? check-box controls the drawing of the border.
The margin options specifies the space between each entry point in the Genome View. A 5-pixel margin is set by default. The margin value is required and must be an integer value greater than or equal to 0.
Some entry points might not have cytogenetic banding information defined. If an annotation track without data is drawn in the cytoband style, an empty space will be drawn. When viewed next to entry points that do have this data, the results can be visually unappealing. The Draw empty track for Cytoband tracks without data option can be enabled to draw an empty chromsome structure for the entry point missing cytoband information.
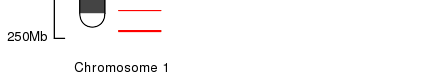
The Chromosome View draws annotations from a specific entry point onto a single canvas. This view usually offers a higher resolution and can typically present more data and utilize drawing styles that can be uninformative at the Genome View level (such as the callout style.)
A slice of a Chromosome View image:
The Chromosome View UI widgets with the Advanced Options expanded:
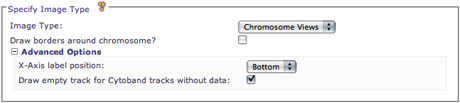
The Chromosome View images can be enabled or disabled by checking or unchecking the Create chromosome views? check-box.
A border can be drawn around the entry point figure in the image, similar to the Genome View. The Draw border around chromosome? check-box controls the drawing of the border.
If an X-Axis label is specified, you can control where on the Chromosome View image the label will appear. You can chose to draw the label at either the top or bottom of the image. The X-Axis label position drop-down box controls the drawing position.
Slice of a Chromosome View image with the X-Axis label position set to bottom.
Some entry points might not have cytogenetic banding information defined. If an annotation track without data is drawn in the cytoband style, an empty space will be drawn. When viewed next to entry points that do have this data, the results can be visually unappealing. The Draw empty track for Cytoband tracks without data option can be enabled to draw an empty chromsome structure for the entry point missing cytoband information.
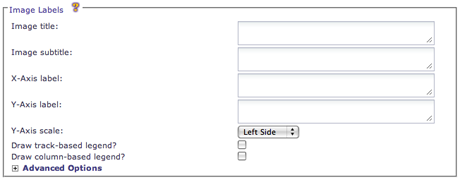
Image labels can be added to convey additional information and help orient image viewers. All the Image labels are optional and if left blank or unchecked will be omitted from the created images. Also, any leading and trailing white-space will be removed from any text input options, if specified. Multiple lines in a text field are supported.
The image labels are text components. The font size, color and face of all text components in VGP images can be customized. The options for these settings are under the Advanced Options section. These settings are hidden by default but can be exposed by clicking on the Advanced Options title. The font size is required and must be an integer greater than 0 point. Clicking the color palette icon will display a panel of selectable color options. You can also change the font color by manually entering the hexadecimal color value into the input. The color swatch before the input will display a sample of the currently selected color.
Image label components displayed on a Chromosome View
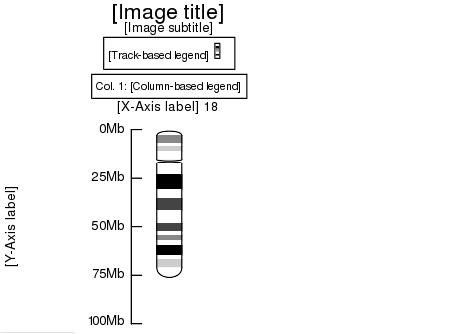
Image labels UI widgets with the Advanced Options hidden:
The specified title text appears at the top of the images. If left blank, no title text will be drawn on any images.
The subtitle text appears just below the title and is, by default, approximately 60% of the image title size. If left blank, no subtitle text will be drawn on any images.
The X-Axis label text is most often used to convey information about entry points. For the Chromosome View you can specify whether the X-Axis label should be drawn at the top or bottom of the image. The X-Axis label will always draw at the top of the image in the Genome View. If left blank, no X-Axis label will be drawn on any images.
NOTE: VGP automatically appends the entry point name to the X-Axis label text for Chromosome View images. If your entry points are chromosomes then only the chromosome number will be appended.
The Y-Axis label text is drawn as vertically-oriented text on the far left of all images. If left blank, no Y-Axis label will be drawn on any images.
The Y-Axis scale can be used to provide a positional context for your images. The Y-Axis scale, if enabled, will be drawn from the start of the entry point to approximately the end, providing position increments along the way. The Y-Axis scale has four configuration options: No Scale, Left Side, Right Side or Both Sides.
NOTE: The Both Sides option only applies to the Genome View image. If selected, the Y-Axis label will be drawn on the Left Side of the Chromosome View images.
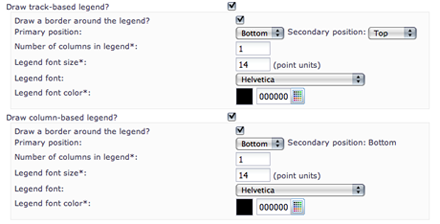
Legends can be added to your images to provide additional information to viewers. The track-based legend provides keys for each unique annotation track that exists in the images. The keys provide a text description of the track as well as an icon representing the color and drawing style of the track.
The column-based legend provides keys for each data column that exists in the images. The key provides a text label denoting the physical number of the column (from left-to-right in the image) and a text description of the contents of the data column.
Both legends can be drawn in the same image. However, if both legends are drawn in the same primary position then each legend must have a unique secondary position. The secondary position for the track-based legend can be specified and the secondary position of the column-based legend will be automatically set. Note that the Secondary position widgets only appear when a conflict in the primary position is detected.
The number of columns in each legend can be specified to control the look over the legend. If the number of columns is specified as 1, then a single column will be created from all the keys. If the number of columns specified is greater than or equal to the number of keys available, then a single row will be created from all the keys.
Legend UI widgets:
Data columns are spatial elements that can be thought of as containers for your annotation tracks. Once a data column is created, specified and positioned, then annotation tracks can be added to that column. A column can contain as many annotation tracks as needed. When VGP draws a data column, all the the tracks in that column are drawn (layered on top of each other) in the space that the column occupies. A user can specify the position of a column relative to other columns and add labels to the columns. The Define Data Columns tab contains all the customization options for data columns
Data column UI widgets for adding, updating and removing columns:
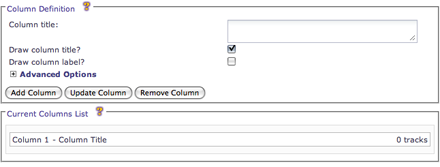
The Current Columns List displays a listing of all the currently added columns. Each item in the list represents a column and displays the position, the specified title and the total number of annotation tracks that have been added to that specific column. Selecting a column from the list will display the specified options for column in the Column Definition widgets.
To add a data column, specify values for the desired options and click the Add Column button. The column will be added as the right-most data column, by default.
The column title is a text label that is drawn above the data column in the created images. The title can be used to provide a brief description of the annotation tracks contained in the column. The column title is optional and if left blank no text will be drawn.
The column label is drawn at the bottom for the data column in the created images and provides positional information to the viewer. The column label is of the form “Column #”, where # represents the position of the column in the figure. The column label can be enabled with the Draw column label? check-box.
The column title and column label are text components and the font attributes for these elements can be specified in the Advanced Options on the Define Data Columns tab.
To update the options for a data column, select the column from the Current Columns List. The values for the selected column will appear in the corresponding widgets. Make the desired changes and then click the Update Column button. If the button is not clicked then the changes will be lost.
The drawing position of the column can be changed by selecting the column item from the list and dragging the item up or down to the desired position. The new position will automatically be saved on release.
To remove a data column from the image, select the column from the Current Columns List. Click the Remove Column button to completely remove the column. Any annotation tracks that were added to the column will also be removed.
Any annotation track that exists in your Genboree database can be added to your VGP images and visualized in a variety of drawing styles. Annotation tracks are added to a data column and are drawn in the data columns position, along with any other tracks in the column. The Add Annotation Tracks tab in the UI allows you to add and specify tracks.
VGP creates low resolution images of entry points. Because of this, VGP cannot draw every piece of annotation present at every base pair in the entry point. To accurately represent the visible annotation in the image space, VGP performs a culling phase on all annotation tracks that are drawn. During the culling, VGP determines which annotations will be visible on the image and discards those that are not. Note that as many annotations will be drawn as possible, but due to the available space some annotations will not be represented in the final image.
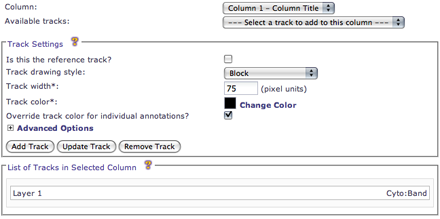
Annotation Track UI widgets for adding, updating and removing tracks:
The reference track is a special annotation track that, as the name suggests, is meant to be the reference that other annotation tracks are drawn in relation to. The reference track is used most commonly in conjunction with the cytoband drawing style. If a track is drawn with the cytoband drawing style and the annotations in the track contain banding information, then VGP will produce a cytoband structure, with proper staining colors.
When the reference track checkbox is checked, it will automatically change the drawing style of the track to Cytoband. This is done to help reduce the possibility of the reference track not appearing correctly. The drawing style does not have to be Cytoband and can be changed.
Only one annotation track can be marked as the reference track. When a track is set as the reference track, its containing column on the Define Data Columns tab will have a gray background set. If a track was marked as the reference track previously and a new track is now marked as the reference, the old track will no longer be the reference. The reference track is not required.
If drawing a track as a Cytoband and the resulting image produces an incorrect structure or staining, ensure that the track is marked as the reference track. If it is and problems still arise, contact your Genboree administrator to ensure the annotation has the proper values specified (i.e. band type).
VGP can draw annotation tracks in one of six different visual representations. The styles and style-specific options are listed below:
- Block - Annotations are represented as colored blocks.
-
Box - Annotations are represented as a colored box with an outline color and
a fill color specified. The box can also have a transparency level set so annotations layered beneath the box can be seen or highlighted.
-
Box fill color
The box fill color specified will be used to draw the box. The Track color specified will be used to draw the outline of the box.
-
Transparency
The transparency of the box fill color. The value must be within the range [0, 100]. A value of 0 means a completely opaque box will be drawn. A value of 100 means a completely transparent box will be drawn.
-
- Cytoband - Annotations are used to create a cytoband structure. If the annotation has properly specified cytogenetic bands, that information will be used to construct and color the cytoband for the entry point.
-
Score - Annotations are represented as a horizontally-oriented bar graph. The score attribute
of the annotation will determine the length of the annotation in the graph.
-
Minimum/Maximum annotation score
The minimum and maximum annotation score options can be set to filter the annotation track. If a the score of a piece of annotation falls outside of the range, it will not be drawn. This option can accept decimal values and can be left blank. If left blank, no restrictions will be placed on annotation scores.
-
Draw axis?
Enable or disable the drawing of a score axis. If enabled, an incremented axis with text labels will be drawn above the track.
-
Threshold line:
A threshold line is a faint gray line drawn at the specified value to help denote annotation score values. This option can accept decimal values and can be left blank. If left blank, no threshold lines will be drawn.
-
Annotation drawing direction:
The scores can be drawn progressing to either the left or right. If you have enabled a reference track and the column for this score track is drawn to the left, you typically want to set the drawing direction to the left. If it is drawn to the right, a right drawing direction is typical.
-
Score overlap mode:
In the event that annotation scores overlap in physical position or in drawing position, the overlap mode can be specified. The maximum or minimum annotation value at that position or the average or median of all values at the position can be specified. This option is in the Advanced Options.
-
Axis increment:
If the axis has been enabled, you can specify the size of increments on the score axis. A text label for the increment will be drawn above the tick mark, if possible. This option can accept positive integer values and can be left blank. If left blank and the axis is enabled, four equal sized increments will be created. This option is in the Advanced Options.
-
Draw grid?
Enabling the grid draws faint gray dashed-lines from the top to the bottom of the annotation track. The interval of the dashed-lines correspond to the increments of the score axis. Note that the score axis does not have to be enabled for the grid to be enabled. This option is in the Advanced Options.
-
Axis label font properties
If the axis is enabled, axis labels will be drawn above each tick mark, if possible, to denote the increment. These axis labels are text components and the font attributes can be specified. These options are in the Advanced Options.
-
- Double-sided Score - Annotations are represented similar to the Score style, in a horizontal bar graph fashion. However, the double-sided score style supports drawing diverging, positive and negative values on the same graph. The double-sided score style has all of the same drawing-style specific options available as the score based. However, because the double-sided score can draw diverging values you can specify both negative and positive threshold lines.
-
Callout - Annotations are represented as text labels with connecting lines to the appropriate
genomic position. Currently the annotation name is used as the text label.
-
Number of characters to show
The number of characters to draw in the callout text can be specified. If the callout text is longer than the specified number of characters, the text will be truncated and an ellipsis (…) will be appended. The minimum number of characters to show is 1 and the maximum is 100. This option is in the Advanced Options.
-
Attribute value for callout text
The text of the callout can be specified by determing which annotation attribute to use for drawing. Any of the 15 standard LFF attributes can be selected, as well as a computed annotation length. Any AVPs specified for the selected track can also be selected. This option is in the Advanced Options.
-
Axis label font properties
The callout annotations are text components and the font attributes can be specified. These options are in the Advanced Options.
Note that annotation is culled to draw the maximum number of callout annotations in the available space. However, due to the size requirements of the callout, it is likely that some annotations will not be drawn. In areas of dense annotation, only a few callouts might be represented.
-
There are also general drawing options available to all drawing styles. The following options can be specified:
-
Is this the reference track?
Mark the check-box if you would like the track to be the reference track. Only one track can be set as the reference track so any previous tracks marked as the reference track will no longer be specified as such.
-
Track width
The drawing width of the track, in pixel units. This option must be a positive integer and is required.
-
Track color:
The color to use when drawing the annotations of this track. This option is required.
-
Override track color for individual annotation?
If any annotations of the track have a specific color set in Genboree, you can use that color to draw that piece of annotation by marking the check-box. If the check-box is unmarked, the Track color will be used for all annotation.
-
Track display name:
The value of the Track display name is used to represent this track in the track-based legend, if drawn. This option is in the Advanced Options and it is required.
-
Margin:
The Margin field specifies space to be drawn between each track. This option accepts zero and positive integers and is required. Note that if multiple tracks are drawn in the same column and you would like all the tracks to line up inside the column, make sure to specify the same margin value. This option is in the Advanced Options.
-
Draw a border around the track?
A single pixel, black colored border can be drawn around each annotation track. Mark the check-box to enable the border text components and the font attributes can be specified. This option is in the Advanced Options.
-
Order in the track legend:
The order of the tracks in the track-legend, if drawn, can be controlled by specifying this value. This option accepts positive integers and can be left blank. This option is in the Advanced Options.
-
Draw annotation with a score above/below
in color : VGP supports autocoloring of annotation that meet certain criteria. A user can specify if a piece of annotation has a score value above or below a specified threshold, then that annotation should be drawn in a different user-specified color. Specify a threshold and choose a color to enable autocoloring. This option is in the Advanced Options.
The autocolor features are available to all drawing styles except the cytoband drawing style.
To add an annotation track to a data column, first select the desired column from the Columns drop-down. Selecting the column from the drop-down will update the List of Tracks in Selected Column with the current tracks that have been added to the column. The Available tracks drop-down list will also be updated to reflect the tracks that can be added to the selected column.
Select the annotation track to add from the Available tracks drop-down. Specify the desired track options and click the Add Track button to add the annotation track to the data column. By default, the track will be drawn at the highest layer, on top of all other annotation tracks in the column.
The Add/Update/Remove Track buttons will be disabled if a data column has not been added yet.
A specific annotation track can only be added to the same data column once. When the track is added, it will disappear from the Available tracks drop-down.
To update a track, select it from the List of Tracks In Selected Column. Selecting the track item will populate the UI widgets Track Settings section with the currently set track options. Change the desired options and click the the Update Track to save the changes. If the button is not clicked then the changes will be lost.
The layering of an annotation track can be changed by selecting the track item from the list and dragging the item up or down to the desired position. Moving a track to a higher numbered layer (dragging down) will cause the track to be drawn on top of lower numbered tracks. The new layer position will automatically be saved on release.
To remove a track, select it from the List of Tracks In Selected Column. Click the Remove Track button to completely remove the track. The corresponding column item on the Define Data Columns tab will update the number of tracks to reflect the change.
When a track is removed, it will become available again to be added to the selected data column. The track name will be added to the end of the Available tracks drop-down list.
When you have finished specifying how your VGP images should be created, you can submit the job to the Genboree servers for processing by going to the Submit tab.
Submit tab UI:
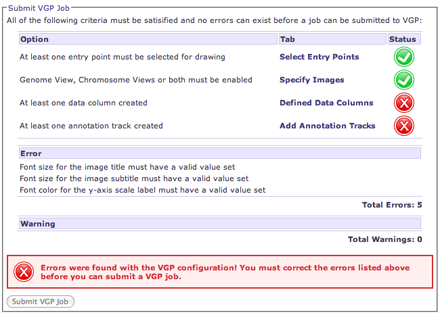
The Submit tab also informs you of the status of you current VGP configuration. To submit a job, there must be no errors in your configuration and all of the required options must be specified. The options table at the top of the page will display the options and their current status.
The errors table will inform you of any specified options that have invalid values set. All errors must be fixed to submit a job.
The warnings table will provide information about specified options that have values that might produce unexpected results. The warnings do not have to be removed before submitting a VGP job and can be ignore if they are expected.
Upon submitting the job for processing, the server will be sent your request and return an acknowledgment. If an error occurs while communicating with the server, an error message will be returned. If the request occurs successfully, you will be informed and given a Job ID for your VGP job. When the job has finished processing, you will be notified via email and provided a link to visit so you can view the results.
If you have any questions about a submitted VGP job, contact your Genboree administrator and provide them with your VGP Job ID so they can properly assist you.

|
Genboree is built & maintained by the Bioinformatics Research Laboratory
within the Human Genome Sequencing Center at Baylor College of Medicine.
Genboree is a hosted service, but code is available
free for academic use.
|

|
|
© 2001-2026 Bioinformatics Research Laboratory
(400D Jewish Wing, MS:BCM225, 1 Baylor Plaza, Houston, TX 77030, 713-798-5433) |
|